Create accurate showback/chargeback reports
A common manifestation, or output, of cost allocation are showback/chargeback reports. MegaBankCorp does not yet have a formal chargeback policy, but it’s on the horizon. Still, they adopted a “single pane of glass for a single source of truth” approach, with a dashboard that gives them showback information that different parties can slice and dice to visualize where the costs are going.
 Michael the CDAO sees how much each department, or project, is spending on cloud data costs—Marketing, Finance, Product Development, etc.


 contribute to costs.")


All screen shots courtesy of Unravel.
For an example of what pinpoint cost allocation looks like, check out Unravel’s 3-minute demo video or self-guided tour here.
Getting a handle on cloud data costs at this level provides a lot of business insights. You have the cold hard facts, real-time data, actual dollars and cents about how the company is spending money on running its thousands of data workloads. Often those insights trigger further investigation.
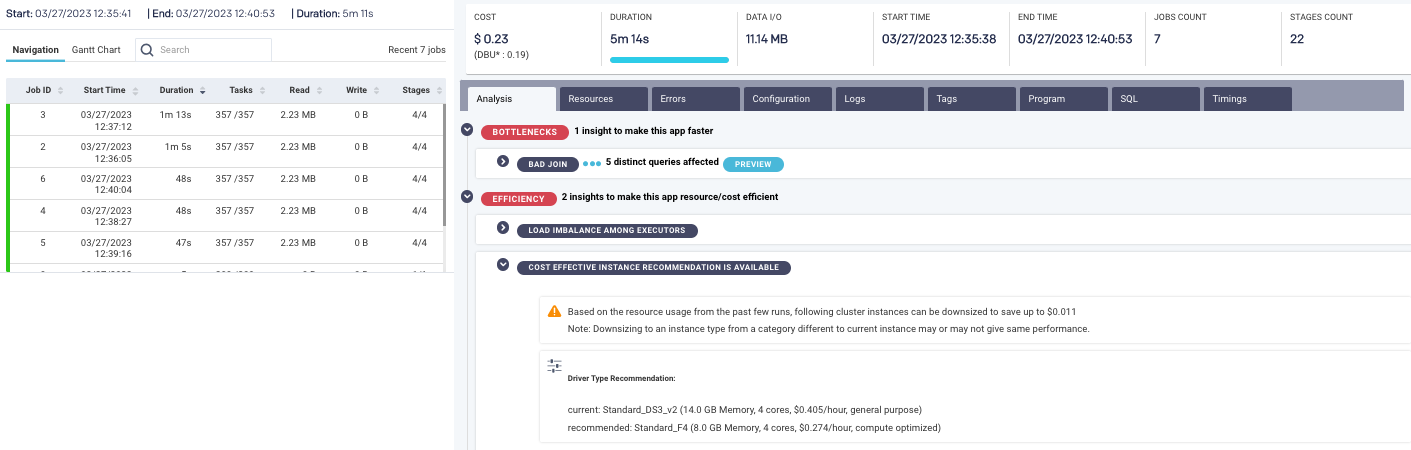
MegaBankCorp dashboards alone give the business—from the c-suite on down, all through Finance and product owners, Engineering team leaders—what they need to know about how much cloud data workloads are costing. But quite often Sammi and Raj need to go “under the hood” and dive a bit deeper into why, from an engineering perspective, things cost what they do.
Just below the dashboards, on the same page, MegaBankCorp has a filterable list of all the individual jobs, users, applications—whatever they’re looking at—that comprise the dashboard information, with the ability to drill down into the (progressively granular) details. Here, it’s all the Spark jobs they had running.

Then they have one-click drill-down into the weeds, into the metrics, timings, DAG graphs, dependencies, parallelism, logs and error messages, code, configuration, and such.
Chargeback reports must be highly accurate, or they do more harm than good. Ensure that there are no gaps in accounting for all the various cloud data costs. All parties must have confidence in the report’s data.
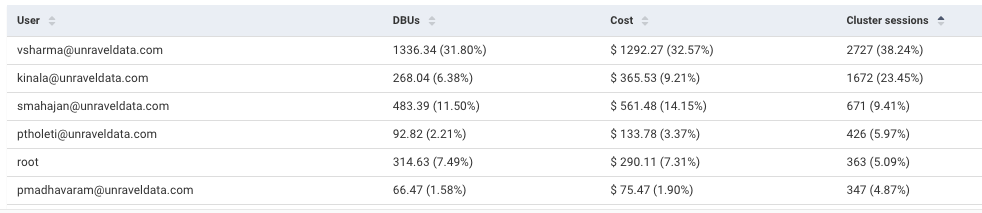
Identify top spenders
When first starting out on your DataFinOps approach, it’s easy to feel overwhelmed by the volume, velocity, and variety of cost being incurred in a complex cloud data estate. You need to prioritize, and most often that means going where the money is.
When Michael from MegaBankCorp tasked Raj and Sammi to get Databricks jobs back on budget, they looked at the thousands of Databricks jobs running every month and didn’t even know where to start.
They could’ve started with the easiest-to-fix, but decided to tackle the most costly first. So they need to see who the “big spenders” are—which departments, teams, applications, users are running up the most costs—and focus their efforts there.
Track actual spend against budget
A key part of getting cloud data costs under control is having a real-time “pulse check” on how each department, team, project—even individual user—is doing against its budget. MegaBankCorp tracks actual and projected usage/cost based on DBUs consumed and uses that data to identify which budgets are on track, which are at risk, or which have already exceeded their budget allocation.

For a practical example of preemptively preventing budget overruns, check out how Unravel does it here.
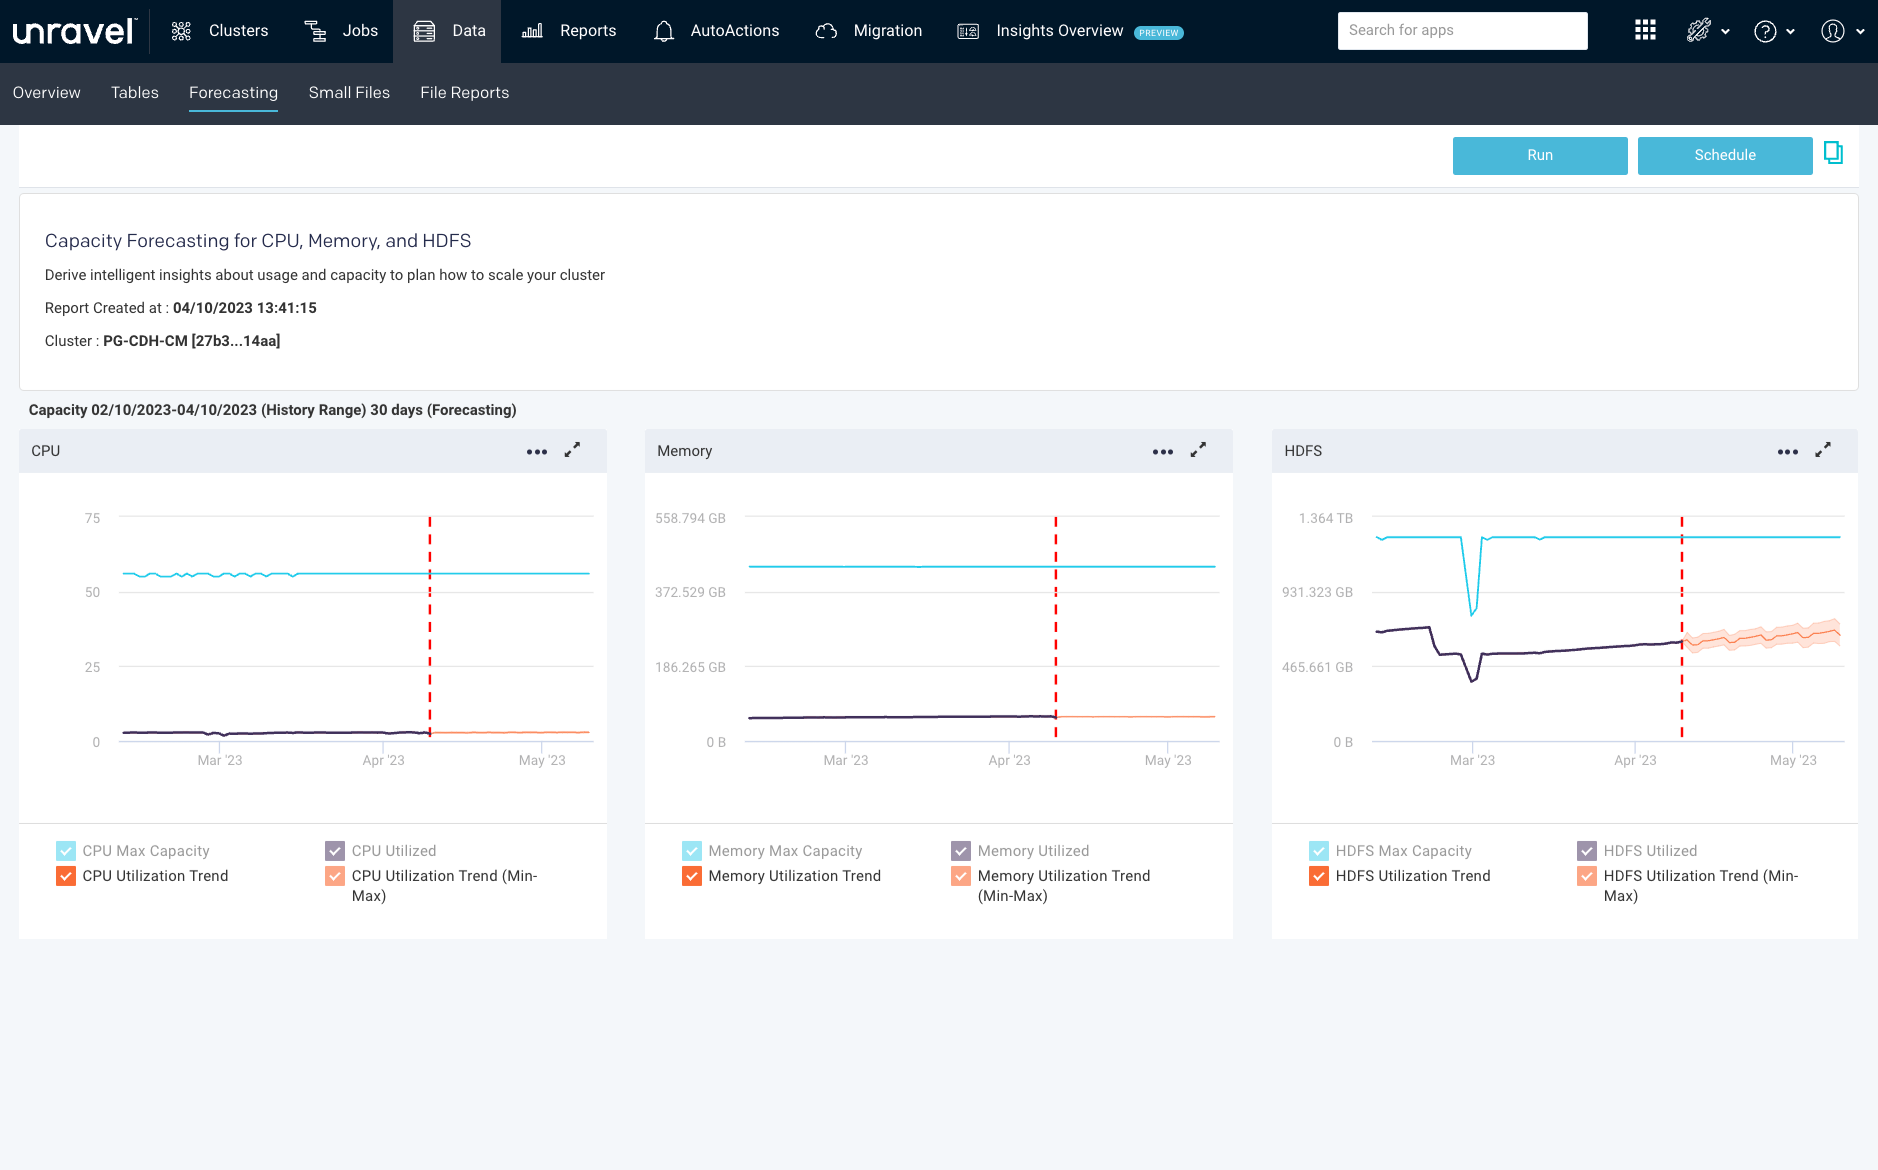
Forecast usage/costs
All too often forecasting the company’s cloud data usage needs (and therefore, its cloud data costs) has become a guessing game. Every month MegaBankCorp’s Finance department, and Nan in particular, feels ambushed by the cloud bill—she’s never exactly sure how much it’ll be for, and even now she still feels a sense of sticker shock.
Cloud data costs can be variable and highly unpredictable, which creates a lot of financial anxiety at MegaBankCorp.
A DataFinOps approach, again using the correlated performance and financial data, runs regularly scheduled reports that analyze historical usage and trends (seasonality, peaks and troughs, auto-scaling) to predict future capacity needs.