Michael and Nan, the CDAO and Finance team leader of MegaBankCorp., had limited visibility into exactly where the cloud data budget was going. Like everyone else, their monthly cloud bill showed a rather opaque, aggregated view of their total spend on various services—compute, storage, platform.
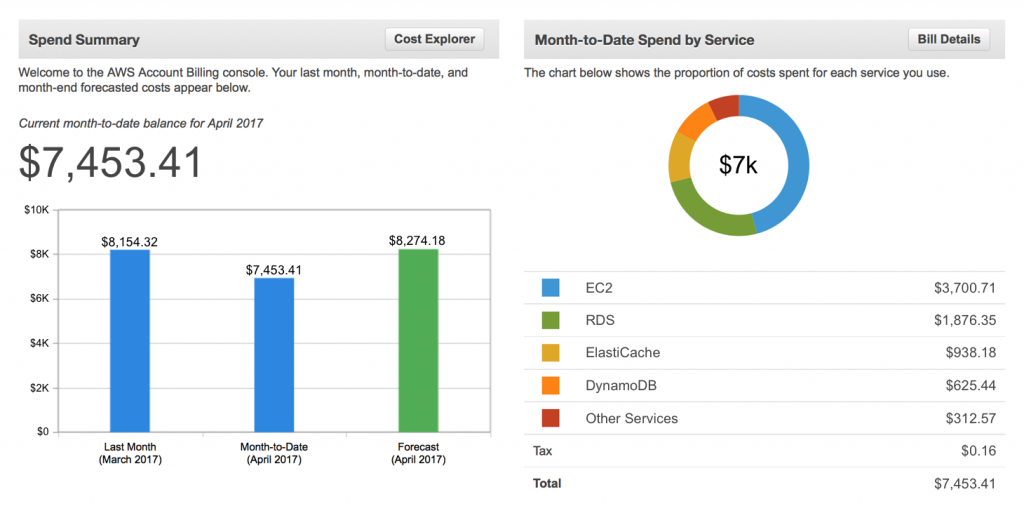
Image source: Amazon AWS
But they wanted to go deeper, to find out which divisions, departments, and LOBs were spending the most, how much specific projects, workloads, or “data products” cost, which applications, which teams, which individual users, had high expenses, and how much.
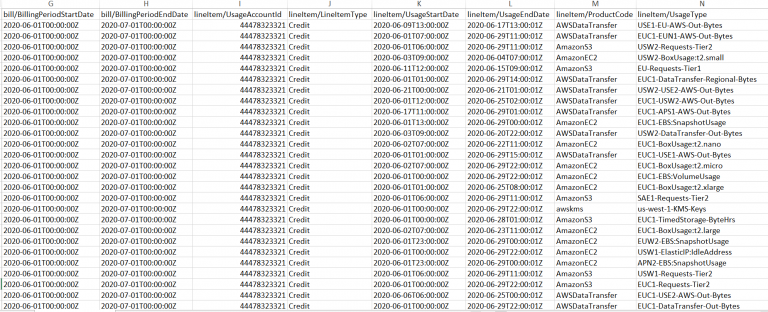
But to get this information, they needed two pretty smart (and expensive) guys with operational engineering experience from Raj’s Ops team (who really couldn’t spare them) to go through 100,000s of individual billing line items to match up which expense went to which user, job, team, department, and so forth, and enter everything in a spreadsheet. Not only was this a huge time-suck and waste of talent, it was always too late after the fact and prone to human error.
The key is to automate as much of the granular-detail collection and correlation as possible. There is simply too much data in too many places than can be handled manually, especially in today’s hybrid, multi-platform, multi-cloud reality. It takes too much time and too much expertise—both of which are already in short supply at MegaBankCorp.
Two core features of DataFinOps automation are data observability and tagging.
Data observability data Data observability tells you not just what’s going, but why. So it’s a lot more than just monitoring. It involves poring through thousands of logs, metrics, traces, events, lineage, dependencies, schema, and the condition of the datasets themselves to extract the pertinent data and help you make sense of it. There are scores of tools available that help you understand the performance, quality, and cost of your cloud data estate. In general, they are all good at what they do but have only some of the information you need, not all. The cloud providers’ and data platforms’ native tools like CloudWatch, Overwatch, and Stackdriver contain key information at the cluster level. Other critical details live deep down at the job, or application, level within Spark, Kafka, Airflow, and all the other components of your modern data stack.
Tagging Most organizations employ at least some level of tagging taxonomy to identify and track usage. Each time someone somewhere incurs a cloud data expense, that usage (and cost) is categorized according to some classification system. It’s not unlike how you categorize your individual travel expenses.
AWS, Google Cloud Platform, and Azure—as well as commercial DataFinOps solutions—all have tools (and lots of thought leadership & best practices) to help set up a cost-allocation tagging strategy.
A couple of things to consider with tagging.
- The tagging has to make sense to everyone. Tagging is what enables you to slice and dice things so that you’re working from the same data no matter which angle you’re coming at it from. First and foremost, tagging structure should reflect the way data workloads actually happen inside your particular business. Use terms that everybody already uses. Remember that these identifying “tags” will be leveraged by different groups of people within the organization, e.g., not just data engineers but Finance and the business.
- Tagging should go deep and atomic. Tag at as a granular level as possible, down into the sub-parts of jobs processing in parallel. Every time any kind of expense is incurred, no matter how small, it should be tagged.
- Information has to be timely. The more real-time, the better. All too often there’s a 24- or 48-hour time lag before you get the data that’s been tagged. You want to see that So-and-so is running a huge—and hugely expensive—job as it’s happening, not two days later after it’s rung up a big expense.